Why return measurement is important?
- For investors, you need to understand the expected average return and maximum loss before making any investment.
- For advisers, you need to set average return and maximum loss expectations up front for your clients.
The challenge of measuring returns taking consideration of human reaction to volatility has been more of an art than a science in the past. A unified return and risk ratio for comparing investment choices on a common-sense basis will greatly benefit investors with the confidence to be emotionally prepared for temporary losses.
The existing measurement ratios such as the Sharpe-Ratio are based on assumptions that are often unrealistic and/or difficult to understand. Not surprisingly, most measurement ratios in the past fail to help advisers and investors in setting the right expectations. For example, an adviser proposed a moderate growth portfolio with an expected annual return of 7%. Two clients had the same risk level assessed but started investing one year apart at the end of 2007 and 2008. The dramatic loss/gain outcome in 2009 made one client happy and the other very angry.
"Investment loss reduction can only be consistently achieved by better portfolio design, not by market timing."
- Charlie Q. Yang (2006)
In the past, many inferior investment funds and strategies have been sold in the investment advisory industry without investors' knowledge due to the lack of a unified standard of performance measurement. Here we are summarizing the evolution path of investment performance ratios which lead the discovery of the new Calmar-Yang Ratio.
Evolution of Return/Risk Performance Measurements
The key to the development of MPT is the placing of severely simplifying assumptions on risks. The behavioral content is ignored and only price volatility characterized by the standard deviation or beta is considered. The financial market crash of 2008, compounded by ever faster trading actions made possible by modern computer and communications network technology, serves as a wake-up call for all investors and government regulators. Many questions remain unanswered. Debates are ongoing to address public concerns and what actions we can take to avoid such a global crisis happening in the future. Even the quick recovery of the stock market in 2009 could not stop many to reexamine the flaws of MPT again.
In Portfolio Selection by Harry Markowitz, investors expect to be compensated for taking additional risk. An infinite number of "efficient" portfolios exist along a curve defined by three variables: standard deviation, correlation coefficient, and return. The efficient-frontier curve consists of portfolios with the maximum return for a given level of risk or the minimum risk for a given level of return. The algorithm used to generate the curve is known as mean-variance optimization (MVO). What is being optimized is return versus standard deviation or variance from the mean return.
William Sharpe extended Markowitz's work by defining the capital asset pricing model, or CAPM. In Sharpe's words, "The CAPM is built using an approach familiar to every microeconomist. First, one assumes some sort of maximizing behavior on the part of participants in a market; then one investigates the equilibrium conditions under which such markets will clear." Sharpe later developed the information ratio, a version of which became known as the Sharpe ratio - the first major attempt to create a measure for comparison of portfolios on a risk-adjusted basis.
The effort to attack the fundamental limitations of MPT is not new. A group of financial industry practitioners already proposed a so-called Post-Modern Portfolio Theory (PMPT) that was summarized in a book edited by Frank Sortino and Stephen Satchell in 2001. PMPT redefines the meaning of risks in a different mathematical term. Downside risk optimization (DRO) is proposed to replace mean-variance optimization (MVO). Instead of standard deviation, DRO uses downside risk. PMPT represents good early attempts in introducing various downside risk measures to more closely capture the human conception of risks than MPT.
However, the investment community still accepts volatility as a common representation of risk. This is because PMPT is far from revolutionary in changing our view of capital market behaviors. It retains the most important traditional assumption: the bell-shaped return distribution. All of the standard qualifiers related to normal (Gaussian) probability distributions still apply. Modern technology advances push for faster information exchanges and investor reactions. The fundamental question is: if financial asset returns do not follow a normal distribution, what is the new and better if any, the scientific foundation of our modern capital markets? These unanswered questions led to the research of Capital Market Behavioral Theory, the discovery of the Q-Distribution, and the Yin-Yang Index by Dr. Charlie Q. Yang from 1994 - 2000.
The New Calmar-Yang Ratio
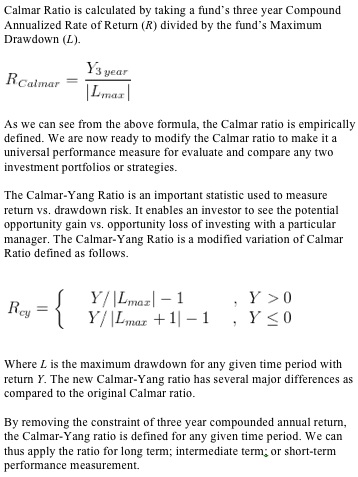
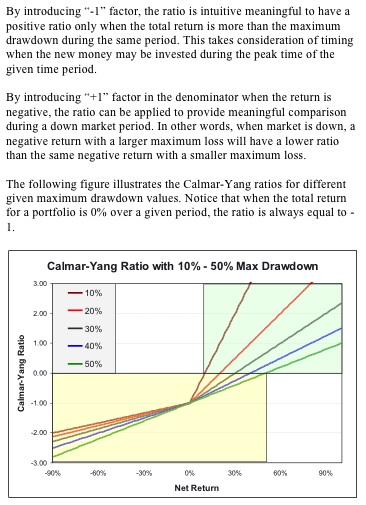
The above-defined Calmar-Yang Ratio can be easily applied to evaluate and compare any investment portfolios on a common basis, The Ratio uniformly captures the short-term largest draw-down which is most beneficial to real-life investors who always concern about the short-term significant volatility much more than the less-meaningful long-term annualized returns. The application of the new Calmar-Yang Ratio has been incorporated into the implementation of the Yin-Yang Index market behavioral measurement system (see examples here). There is a newer uniformed version of the Calmer-Yang Ratio which calculates the ratio from -1 to +1 for easier and more intuitive interpretation. More details on how to calculate the Calmar-Yang Ratio are available upon request.


