Why market measurement is important?
- For investors, you need to understand the market cycle to have the confidence of staying invested.
- For advisers, you need to understand the market cycle to provide prudent advice to your clients.
The challenge of identifying the bull or bear phase of the market has been more of an art than a science in the past. Any scientific tool to help to measure the market will greatly benefit investors to avoid disasters like 2008 happening again. It is all about detecting signals from noise.
An example of some existing market measurement tools is the CNN's Fear & Greed Index. It helps to understand what emotion is driving the market now. However, the index may have its usefulness as a short-term contrarian indicator but it does not tell the current market is in its bear or bull phase. Investors want to have a better measurement to guide their actions of being risk hedged (bear) or fully invested (bull).
ISIR's research on market cycles was started in 1994 when the discovery of the new Q-Distribution (non-symmetric with long tails) challenged the bell-curve model as the only foundation for the Modern Portfolio Theory. This later formed the scientific foundation in developing the new Capital market Behavior Theory (CMBT) and the new Yin-Yang Index for understanding and detecting market trend changes.
1. The new Capital Market Behavior Theory (CMBT) (established in 2000)
The key to the development of modern portfolio theory (MPT) is the placing of severely simplifying assumptions on risks. The behavioral content is ignored and only price volatility characterized by the standard deviation or beta is considered. The MPT failed to interpret and prevent the global financial crisis and capital market panic in 2008.
The key to the development of modern portfolio theory (MPT) is the placing of severely simplifying assumptions on risks. The behavioral content is ignored and only price volatility characterized by the standard deviation or beta is considered. The MPT failed to interpret and prevent the global financial crisis and capital market panic in 2008.
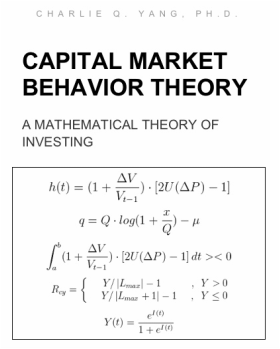
Dr. Charlie Q. Yang discovered a family of non-normal distributions and dual-mode market statistics in 1994. His research was later extended to become a new theory called the Capital Market Behavior Theory (CMBT). For the first time in history, the statistical assumptions of MPT are completely removed and so do the limitations. The findings have been extensively validated by real-time market data since 2000 and evolved to the systematic implementation of the Yin-Yang Index as a new leading indicator of primary market cycles.
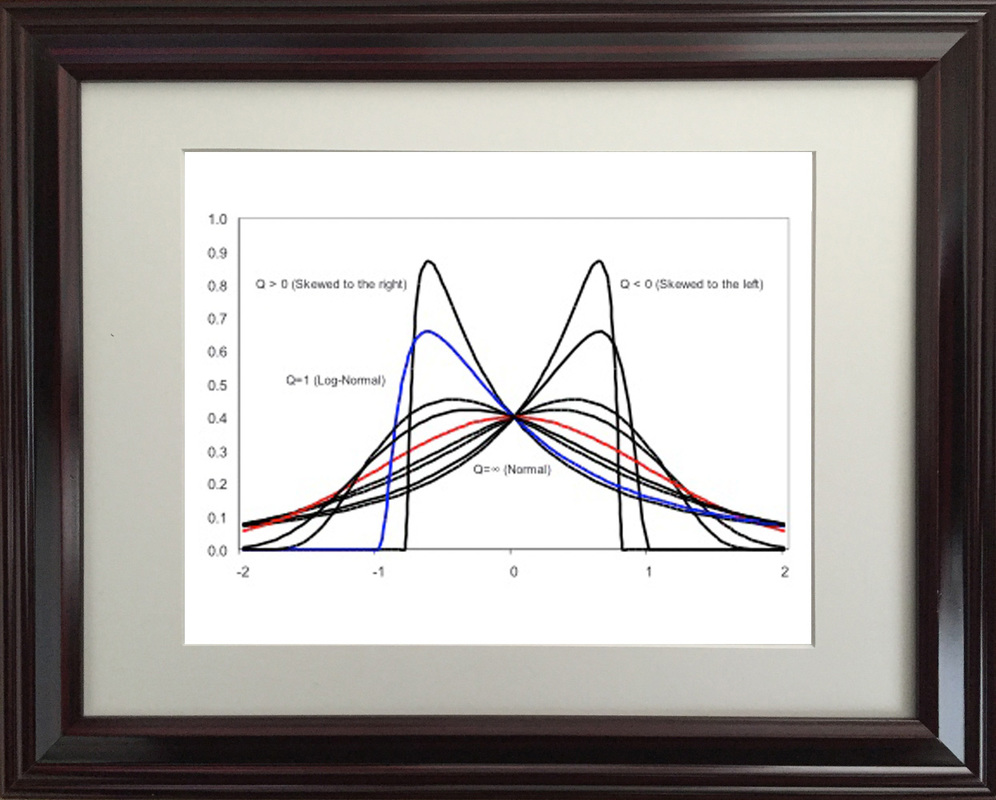
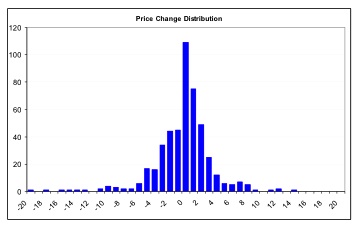
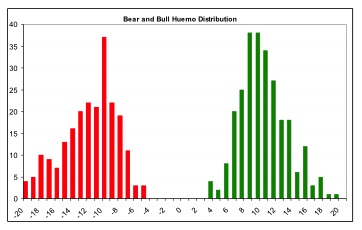
The major CMBT principles are formulated into five equations shown on the left. The fundamental difference of CMBT vs. MPT is that the new CMBT quantifies the market behavior based on market order ticks and volume actions directly and statistically separate the price movements into a dual-mode non-symmetric model (right figure below) instead of the single-mode bell-curve assumed by MPT (left figure below). Further detailed research results are available upon request.
CMBT theory is based on the behavioral interpretation of capital market pricing as follows.
- Capital market pricing is determined by the collective effect of all bullish and bearish investors’ perception on the price;
- Capital market pricing is driven only by the behavior of those investors who take trading actions;
- Fundamental value and technical charting do not directly affect capital market pricing.
|
|
2. The new Yin-Yang Index for market phase identification (developed and validated since 2000)
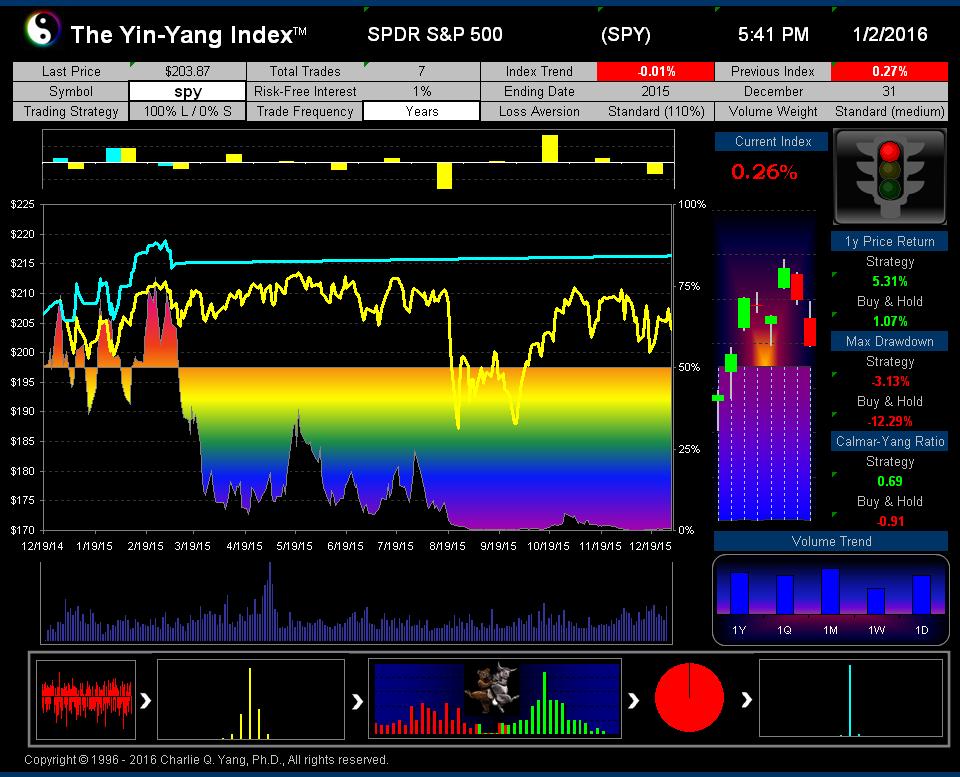
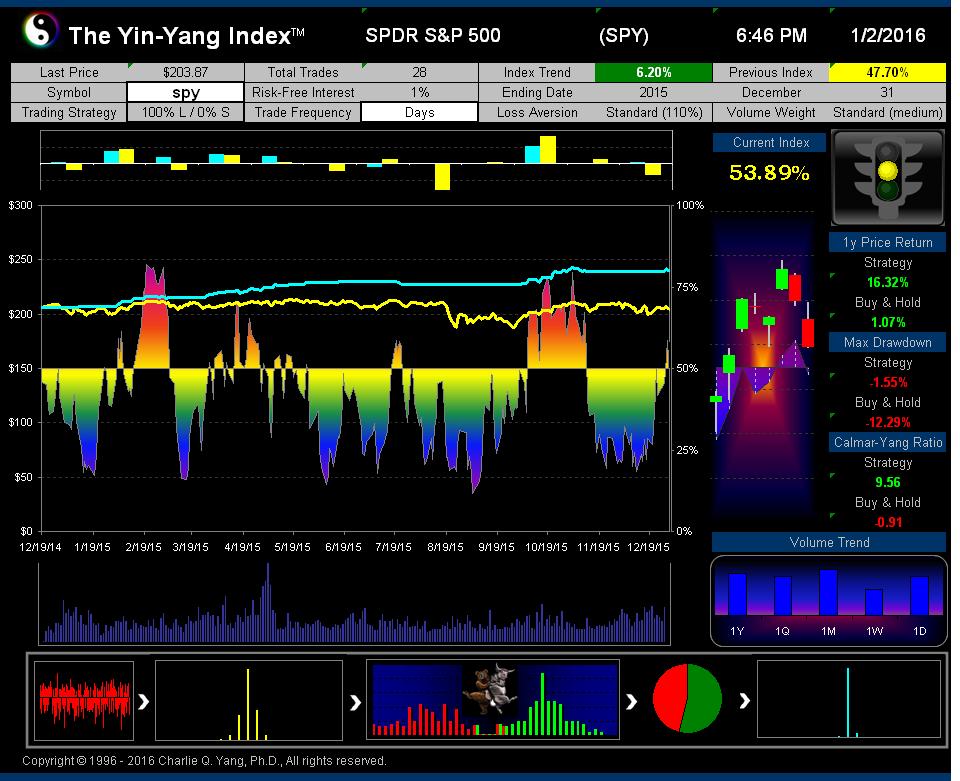
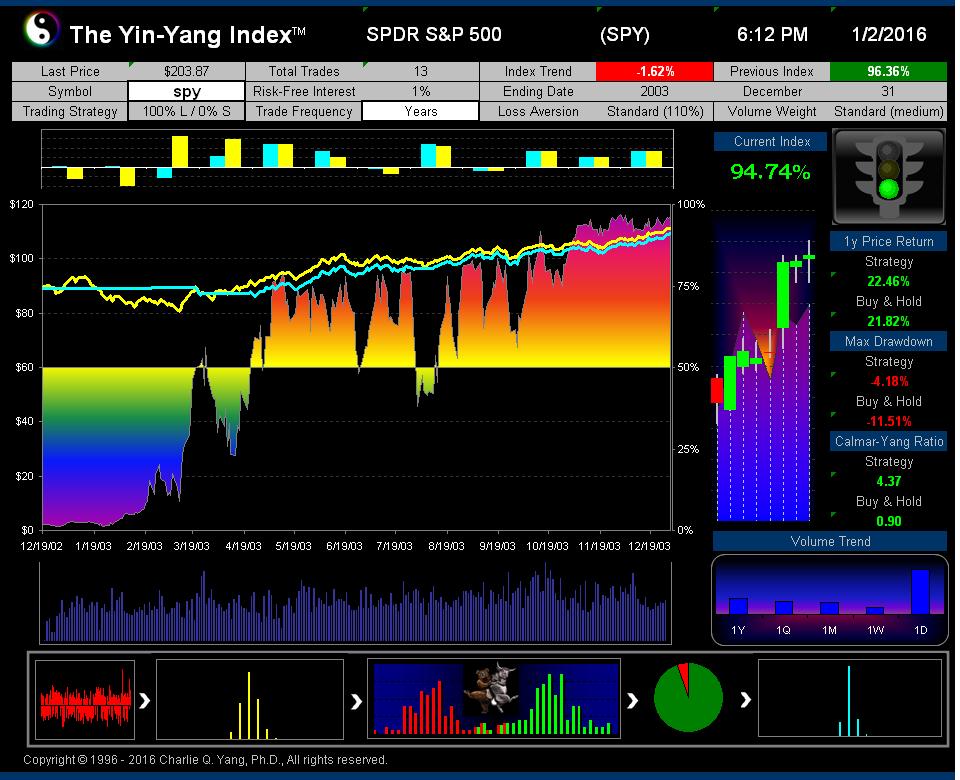
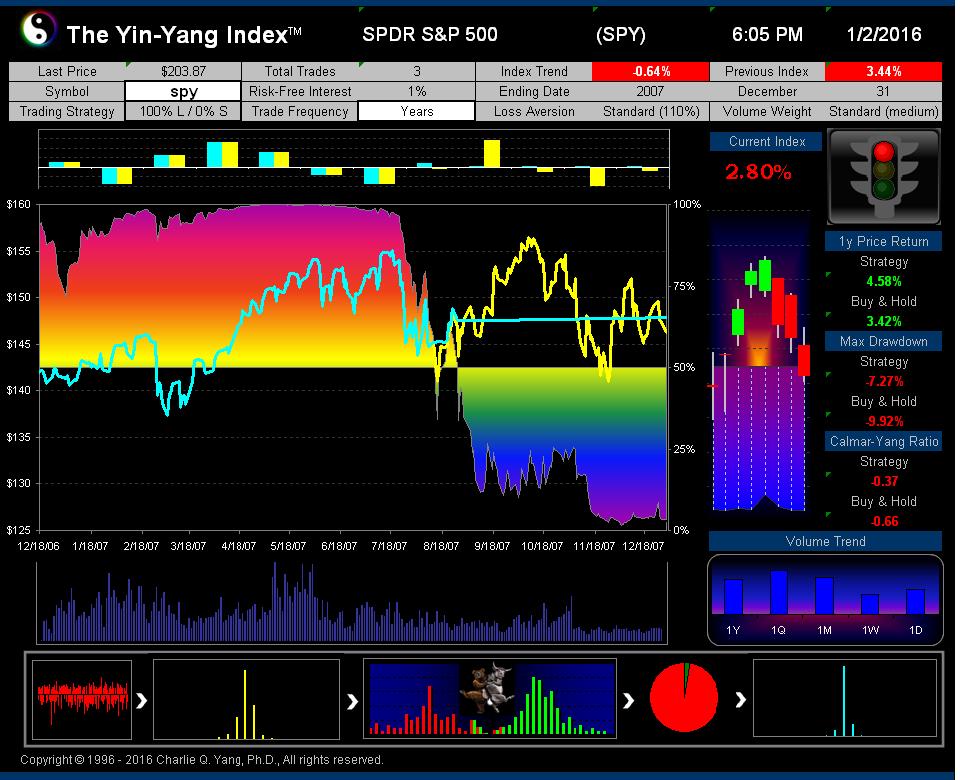
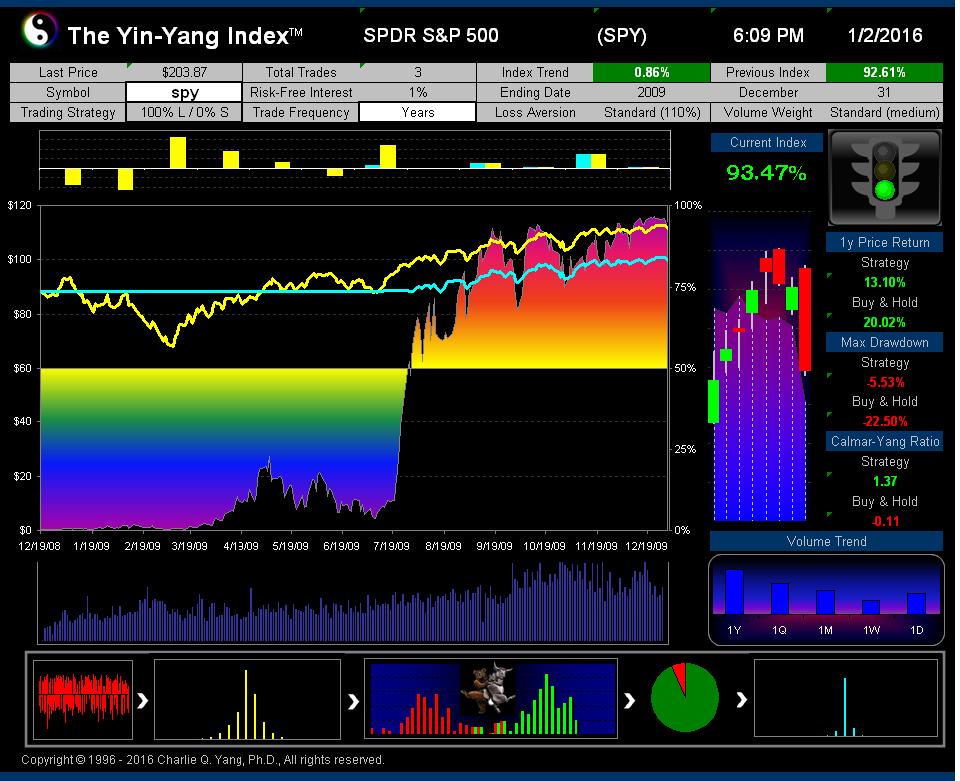
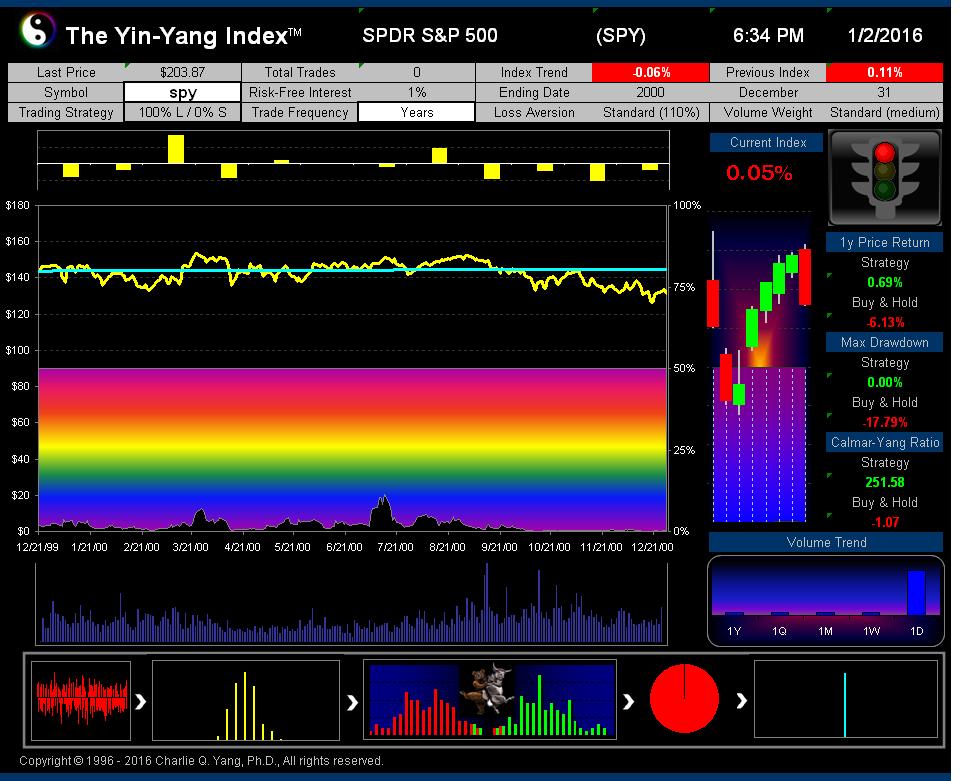
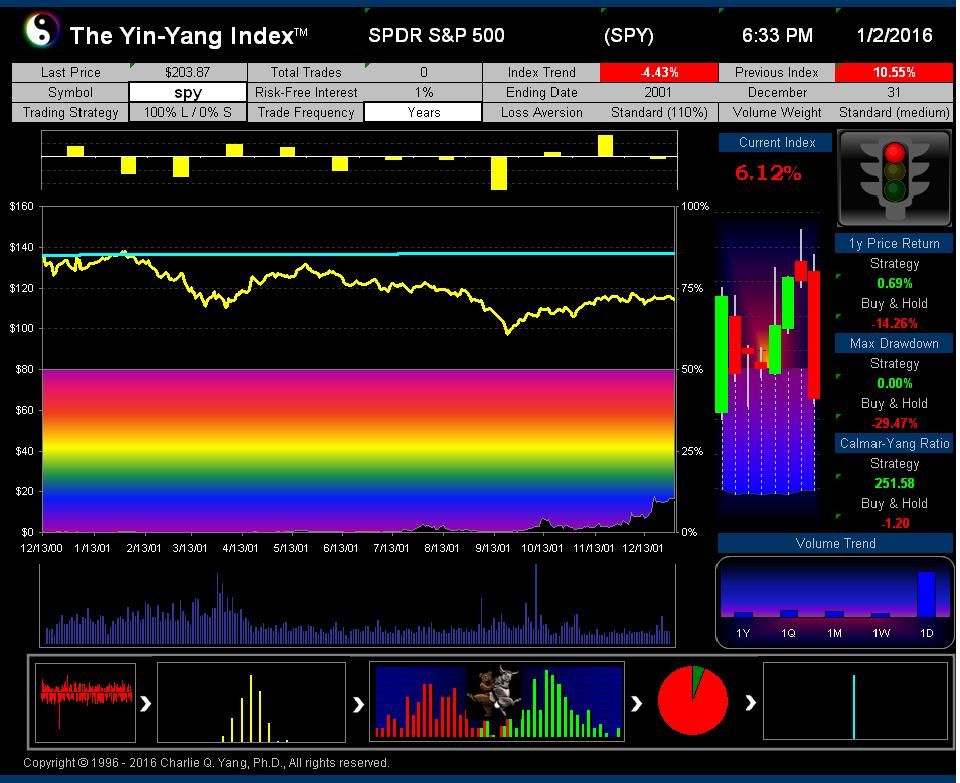
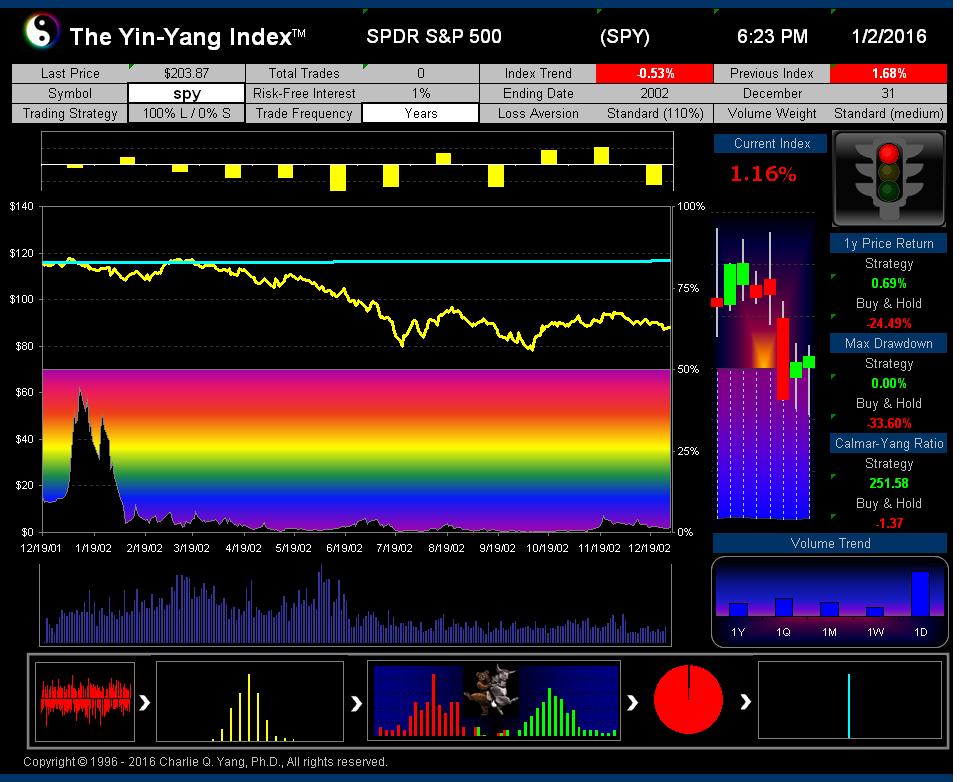
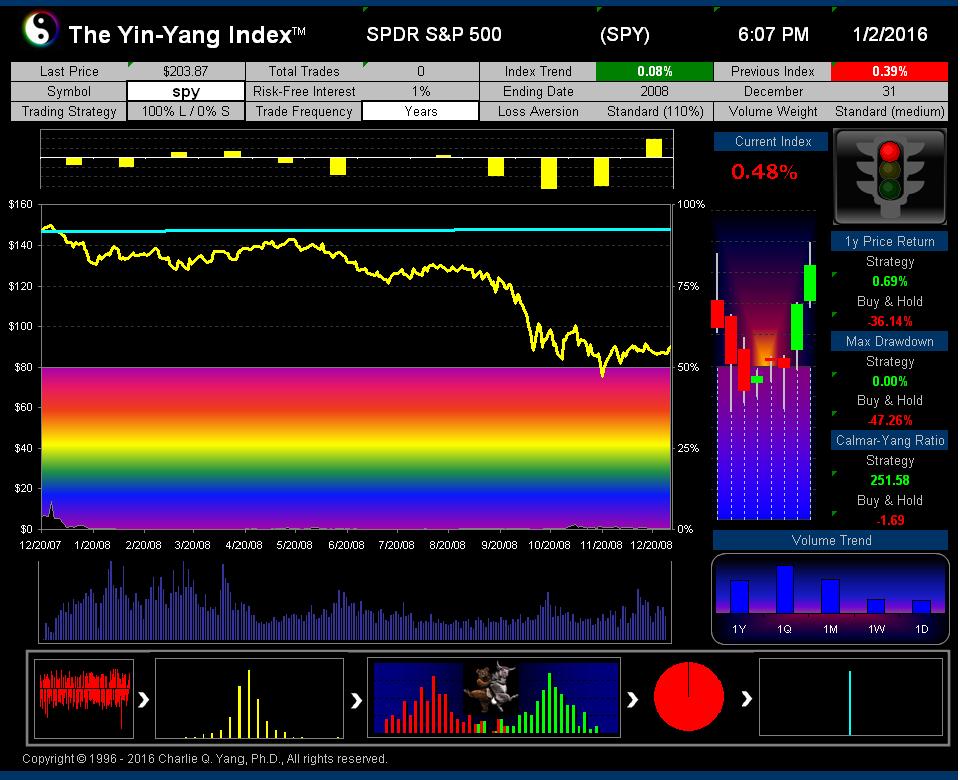
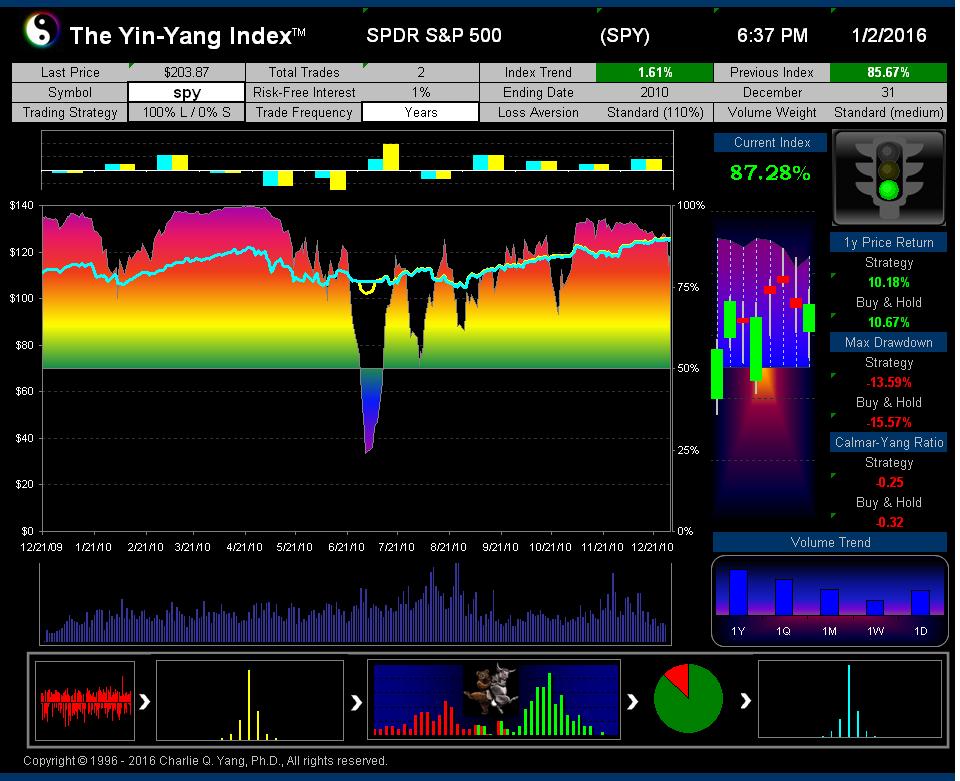
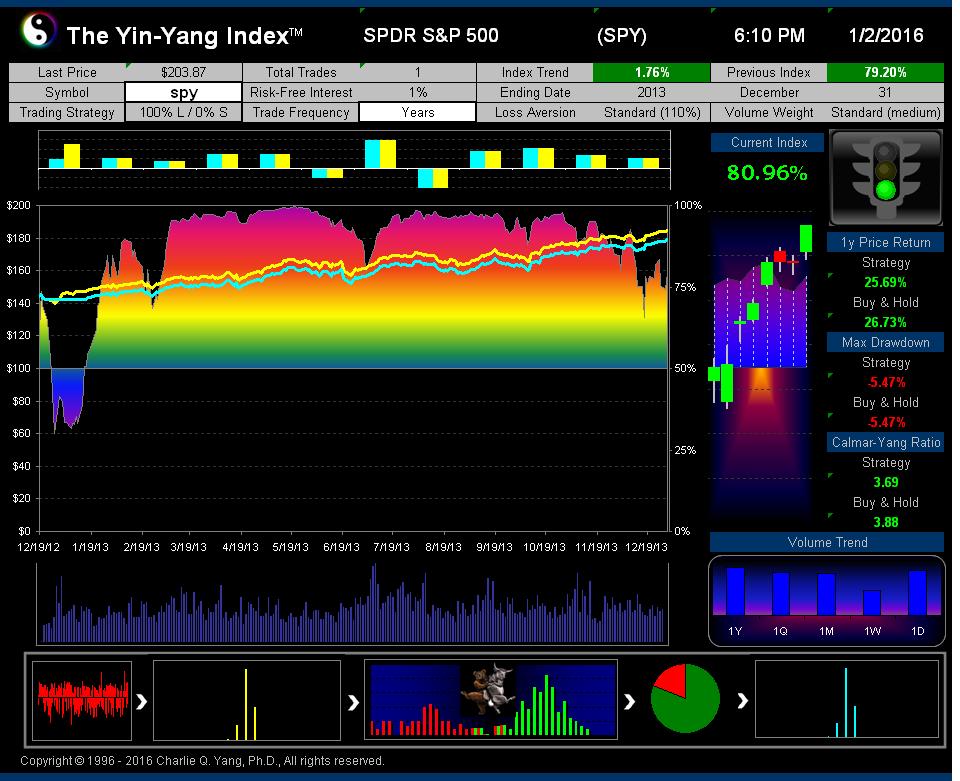
The Yin-Yang Index is a scientific indicator measuring the capital market sentiment developed by ISIR. It is an indicator solely based on intra-day market trading actions to identify market trend changes. It can be used as a market psychology measure or as a long-term market cycle indicator. The following key points highlight why the new Index is fundamentally different and in trend-detecting aspect better than other existing popular fundamental or technical indicators. Further detailed research results are available upon request.
- The Yin-Yang Index calculates the overall sentiments of buyers and sellers for any securities as long as intra-day trading data are available;
- The new discovery underlying the statistical processing of the Index is in its separating all trading actions into a bull and a bear statistical population;
- The dual-mode distributions with possible long tails are calculated to capture the real-world sentiment statistics. This makes the Index fundamentally different from the Modern Portfolio Theory which assumes all market actions form a single mode normal distribution (random-walk theory);
- The Index has been tested and validated with real-time data of some randomly selected securities over their entire trading histories with research results showing that the index can most of time detect the market trend at its early transition stage;
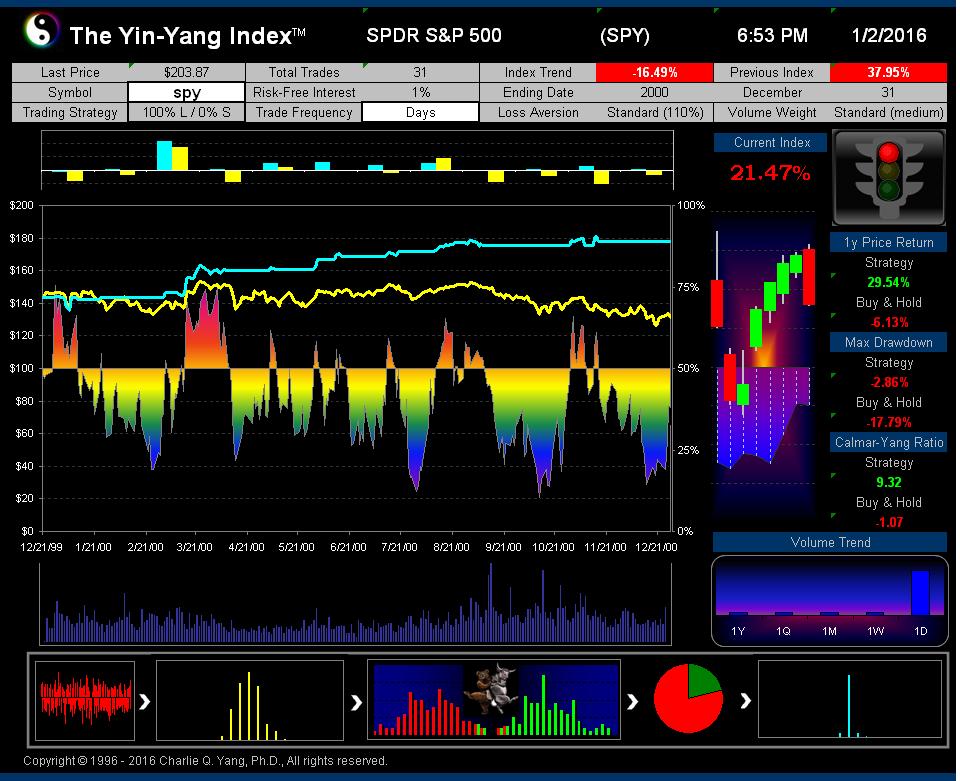
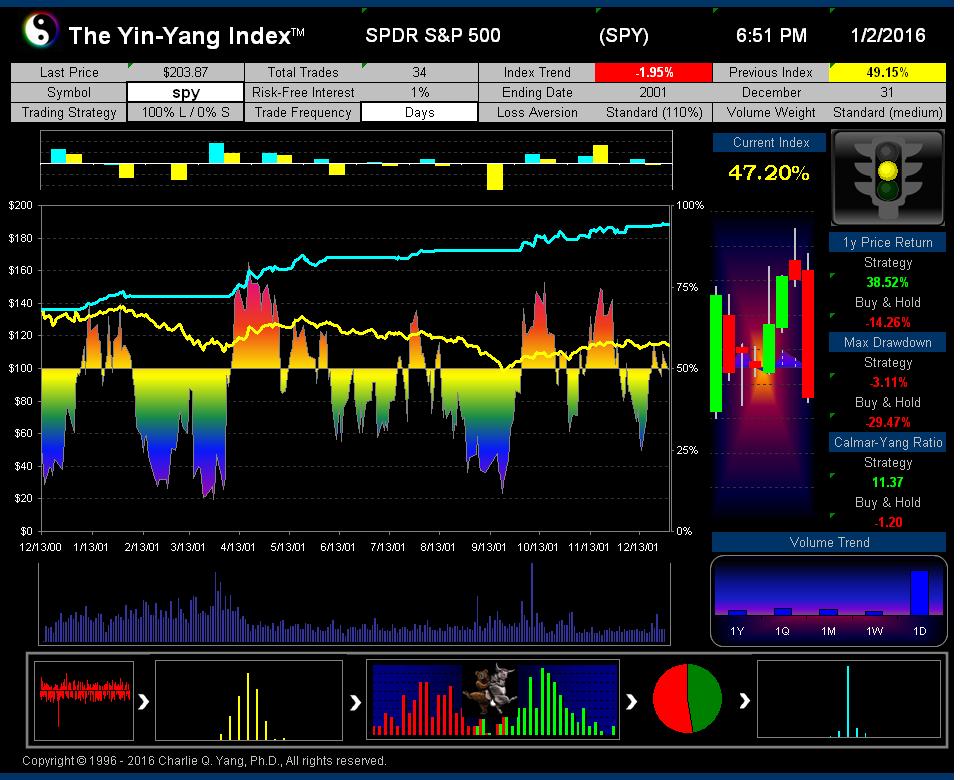
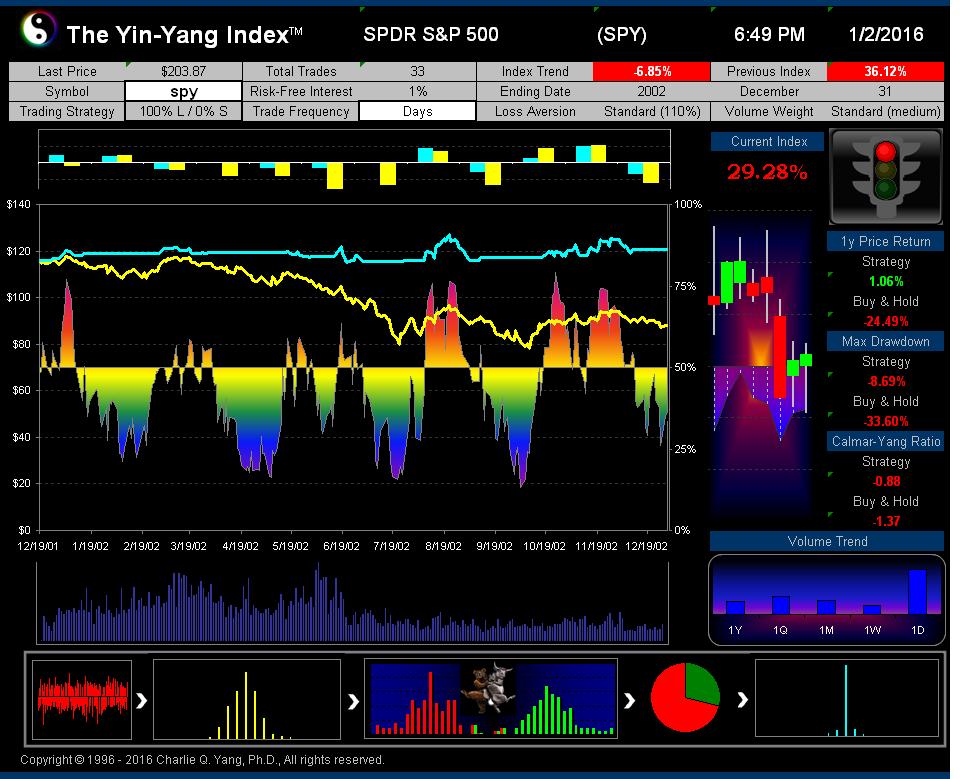
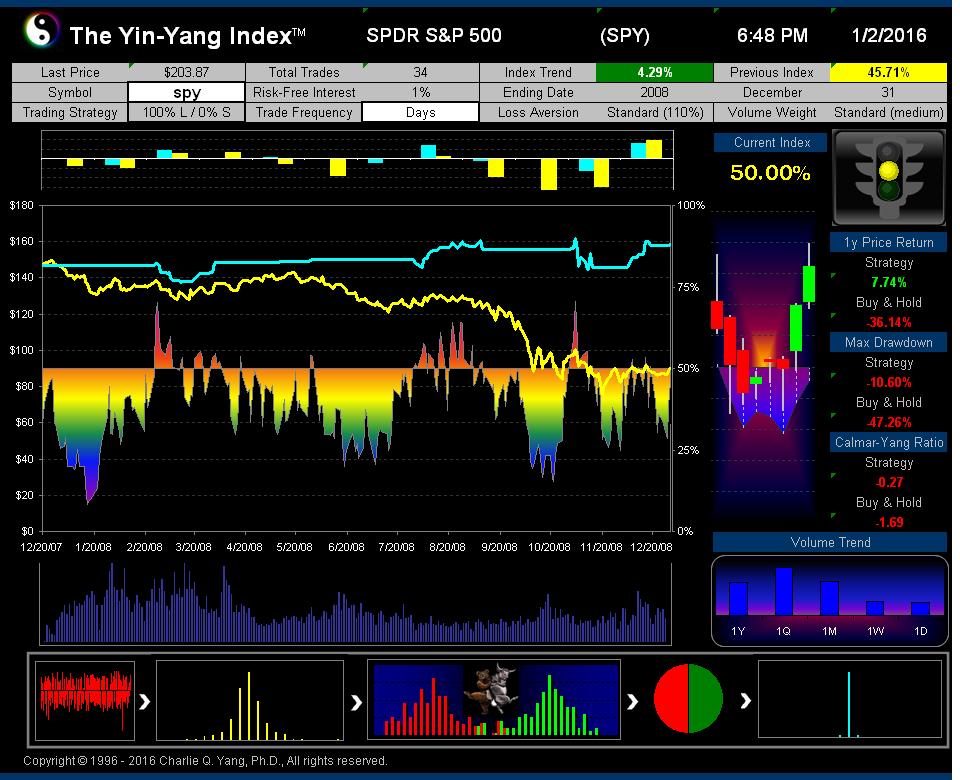
- ISIR believes that the early trading actions from smart money (such as insiders, hedge funds, and financial institutions) cause increasing up-tick or down-tick trades. This is why the Index has surprisingly good accuracy when intra-day data are sampled directly (see chart examples on SPY for bull and bear market detection below).
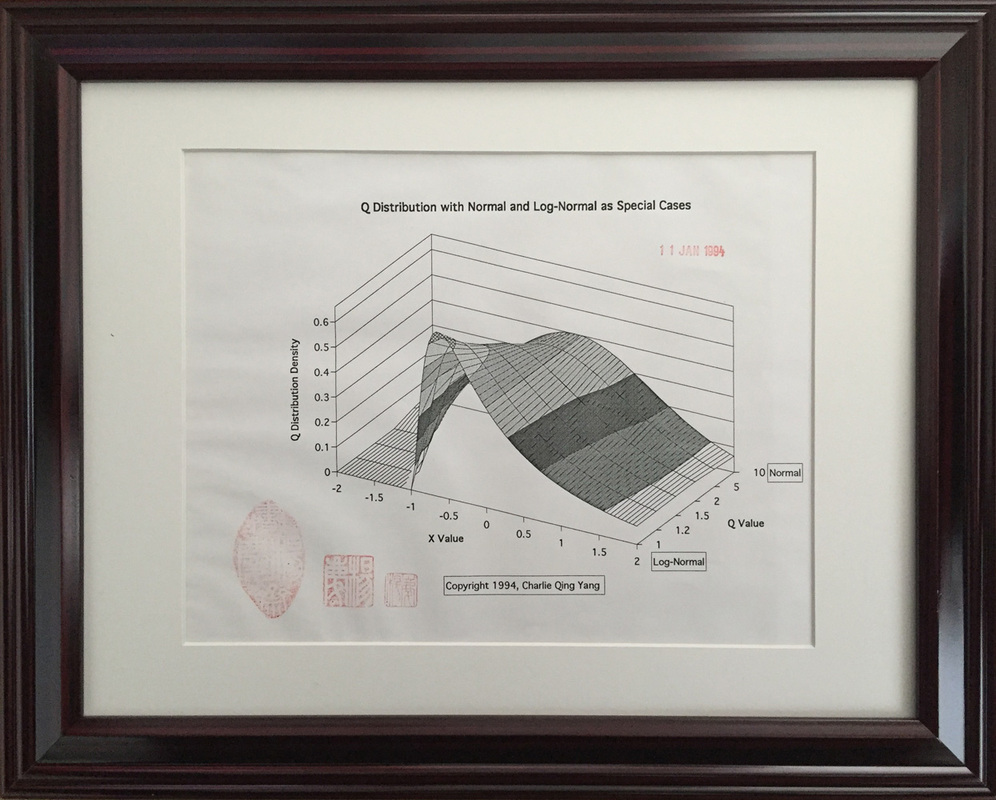
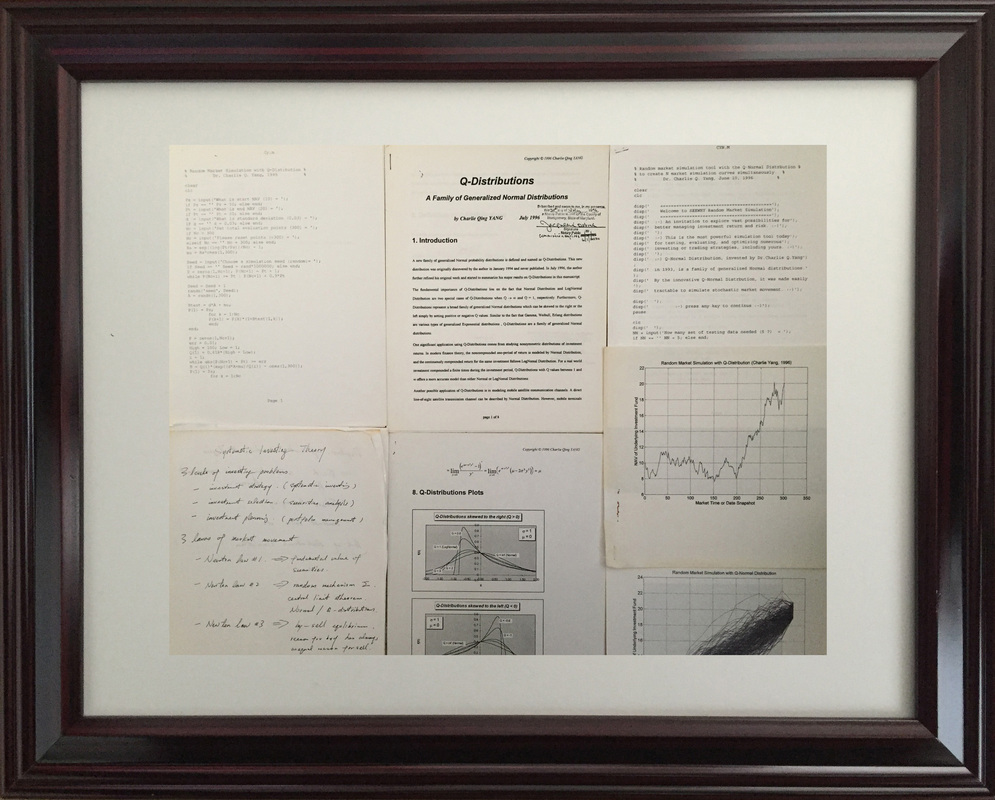
3. The new Q-Distribution for better Monte-Carlo simulation (discovered in 1994 and documented in 1996)
Right after obtaining a Ph.D. Degree in statistical signal detection over noise channels, Dr. Charlie Q. Yang worked as a scientific researcher for Bell-Northern Research in Canada. He soon discovered a new probability distribution named Q-Distribution which captures a family of non-symmetric distribution with a one-sided long tail. The discovery was documented from 1994 to 1996 (see below). Further detailed research results are available upon request.
- The importance of the new discovery is realized immediately Dr. Charlie Q. Yang because it the Q-Distribution includes the well-known Normal Distribution and Log-Normal Distribution as special cases.
- The Q-Distribution later provided a scientific foundation to help formulate the statistical thinking process in developing the new Yin-Yang Index (see above).
- The universal nature of the Q-Distribution enables many possible applications in all different fields for conducting better statistical (Monte-Carlo) simulation because the data modeling is more accurate with a family of flexible non-symmetric distributions than the conventional bell-curve model.